![How to Monitor ArgoCD using kube-prometheus-stack [Part Three]](https://cdn.hashnode.com/res/hashnode/image/upload/v1709928699981/9a8960f6-78ed-4353-b49e-9c0a4aff2e3e.png?w=1600&h=840&fit=crop&crop=entropy&auto=compress,format&format=webp)


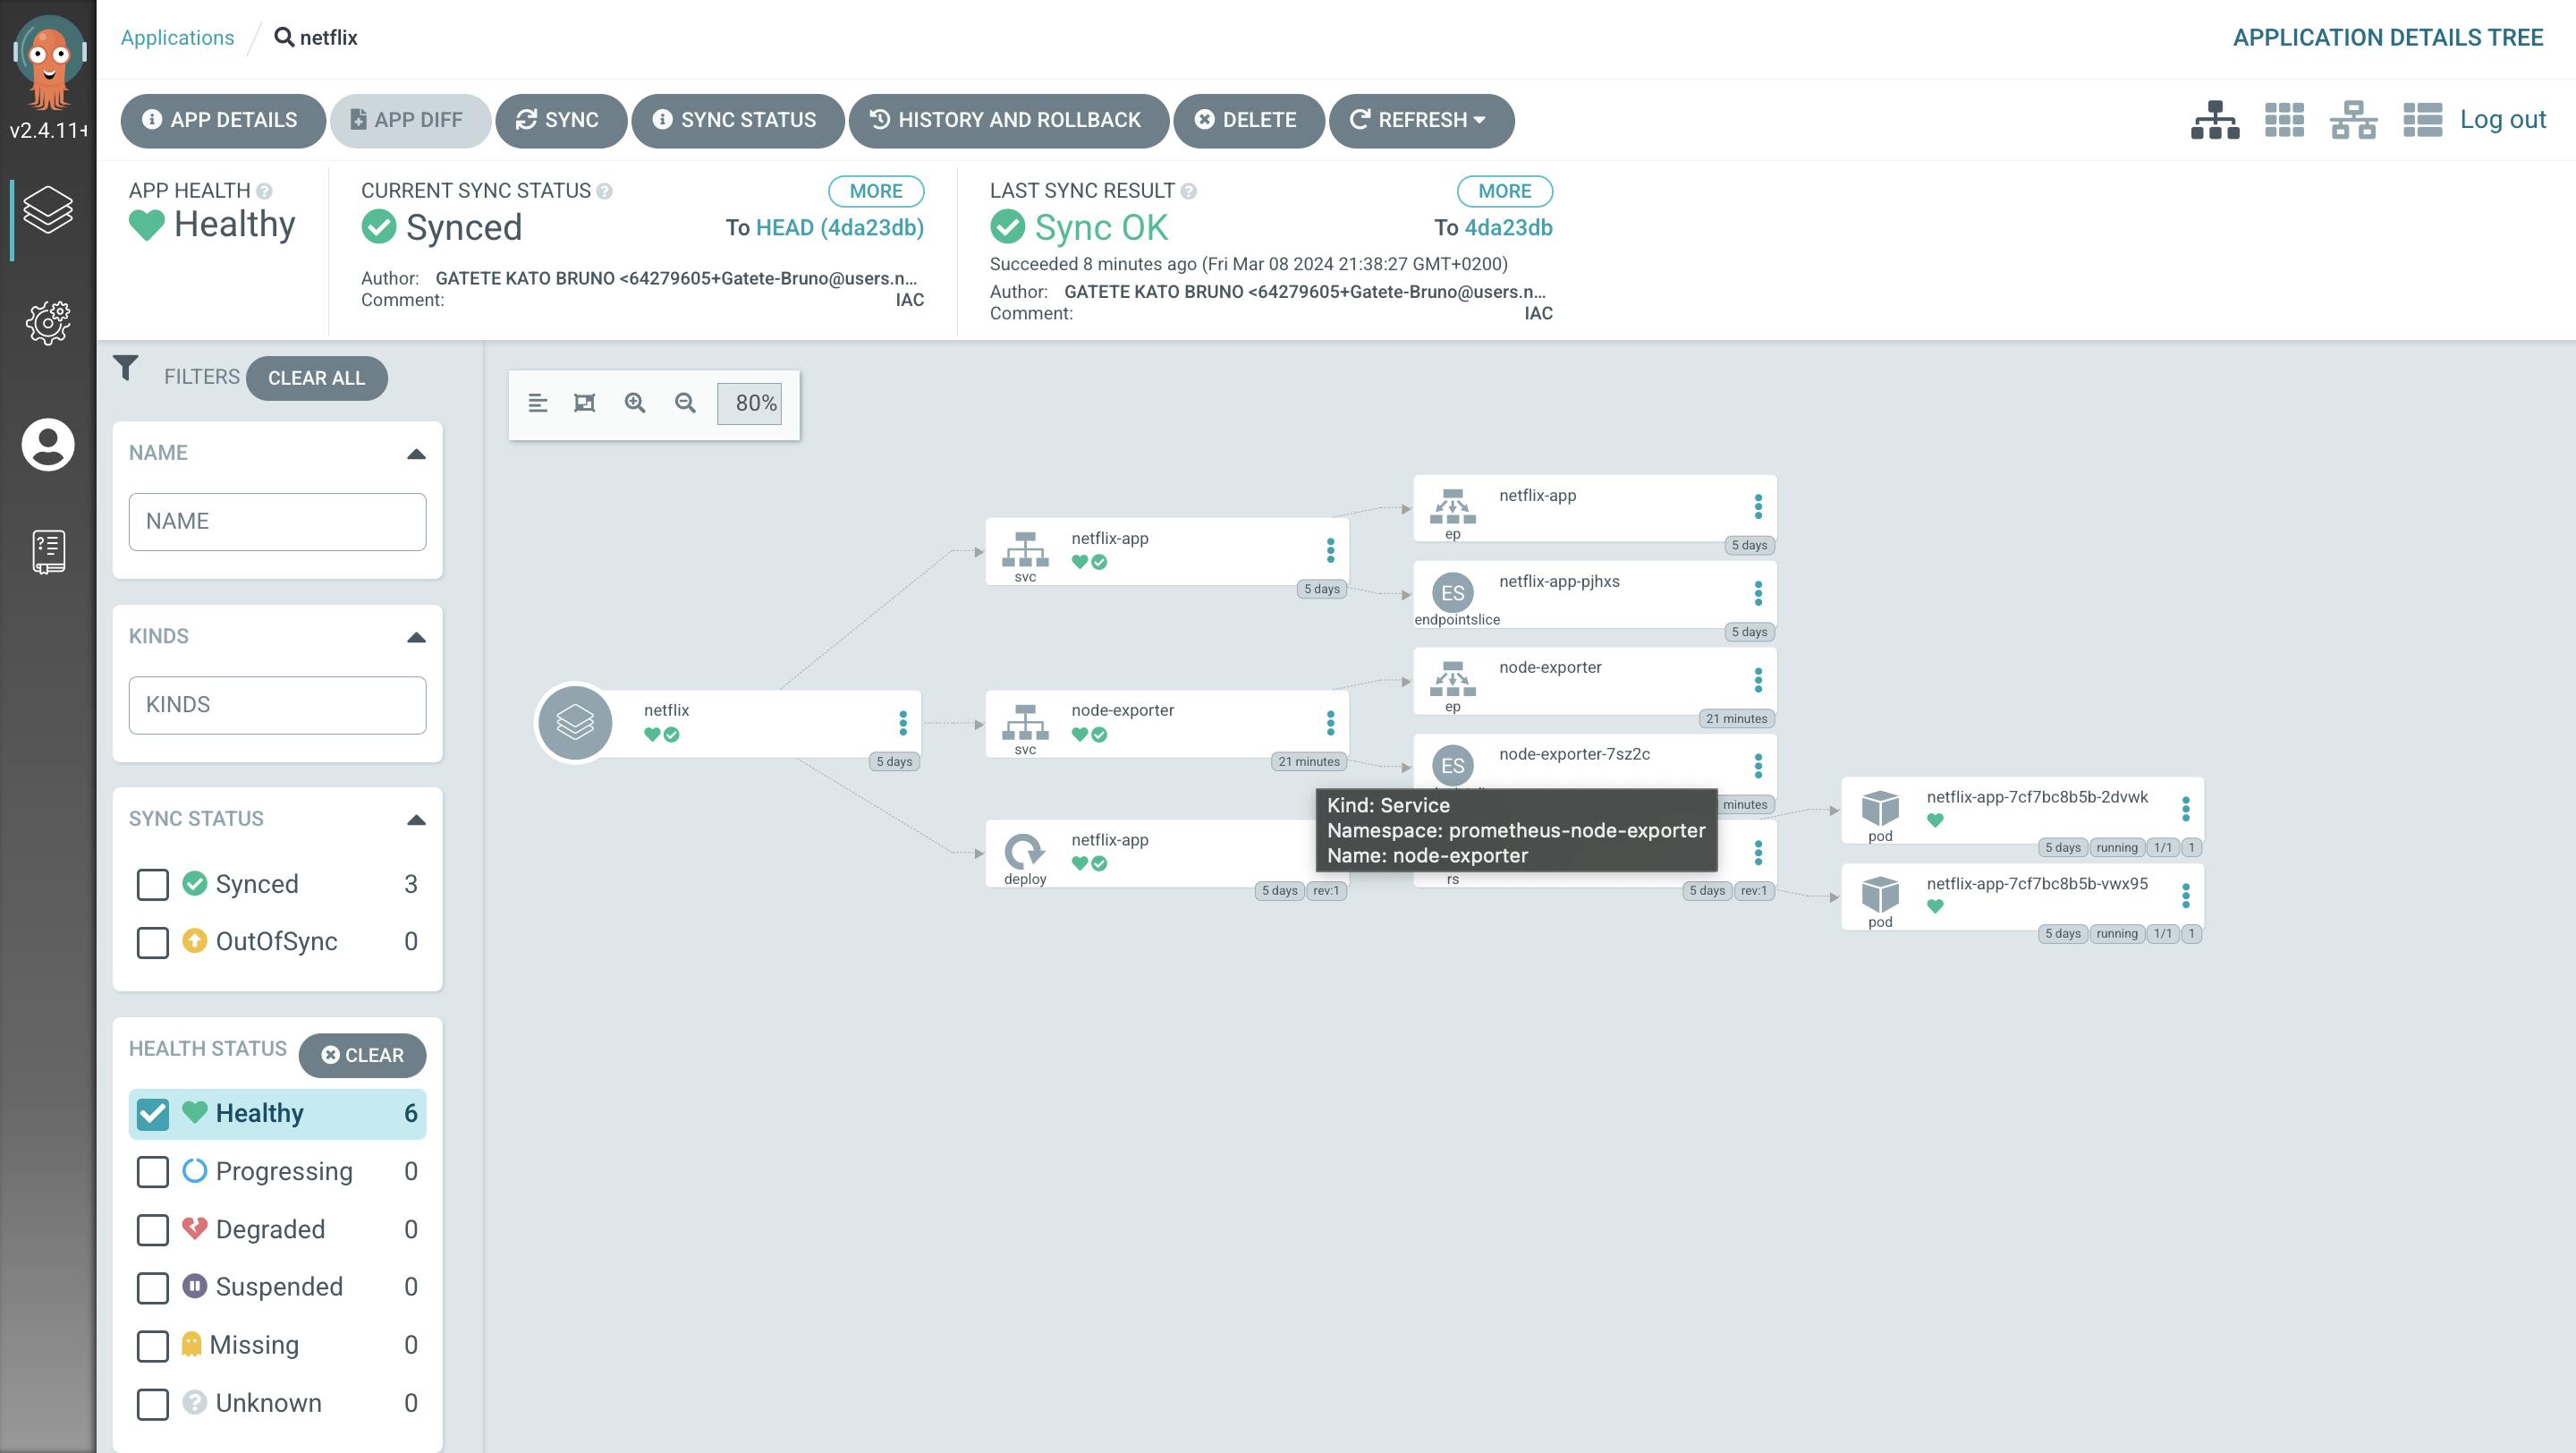
In our previous blog we managed to deploy a Netflix Clone on ArgoCD, You can check it out here
https://gatete.hashnode.dev/local-netflix-application-deployment-with-argocd-on-kubernetes-part-two
Importance of Monitoring in Kubernetes:
- Monitoring is critical for tracking performance and optimizing applications in diverse Kubernetes environments.
Prometheus - Reliability at its Core:
- As an open-source monitoring toolkit, Prometheus is chosen for its reliability, making it ideal for Kubernetes clusters.
kube-prometheus-stack - Unified Monitoring Solution:
This stack simplifies Prometheus operation in Kubernetes, offering predefined Grafana dashboards and adhering to best practices.
Key Components:
Prometheus: Monitoring and alerting toolkit.
Alertmanager: Efficiently handles and routes alerts.
Node Exporter: Collects hardware and OS metrics.
kube-state-metrics: Generates metrics about object states.
Grafana: Provides a comprehensive observability platform.
Prometheus Operator: Manages Prometheus clusters in Kubernetes.
Benefits of Integrated Monitoring:
- Efficiently assess system utilization, identify issues promptly, and make strategic decisions for optimized deployments.
Remember we are deploying the Monitoring components on the same cluster as ArgoCD
Prerequisites
Kubernetes 1.20+
Helm 3+
kato@master1:~$ kubectl get nodes
NAME      STATUS   ROLES                  AGE    VERSION
master1   Ready    control-plane,master   5d3h   v1.23.10
node1     Ready    worker                 5d3h   v1.23.10
node2     Ready    worker                 5d3h   v1.23.10
kato@master1:~$ helm version
version.BuildInfo{Version:"v3.9.0", GitCommit:"7ceeda6c585217a19a1131663d8cd1f7d641b2a7", GitTreeState:"clean", GoVersion:"go1.17.5"}
kato@master1:~$
How to Install using Helm
kato@master1:~$ helm repo add prometheus-community https://prometheus-community.github.io/helm-charts
"prometheus-community" already exists with the same configuration, skipping
kato@master1:~$ helm repo update
Hang tight while we grab the latest from your chart repositories...
...Successfully got an update from the "argo" chart repository
...Successfully got an update from the "argo-cd" chart repository
...Successfully got an update from the "prometheus-community" chart repository
Update Complete. ⎈Happy Helming!⎈
Install Helm Chart
kato@master1:~$ kubectl create namespace monitoring
namespace/monitoring created
kato@master1:~$ helm install prometheus prometheus-community/kube-prometheus-stack -n monitoring
NAME: prometheus
LAST DEPLOYED: Fri Mar  8 19:07:33 2024
NAMESPACE: monitoring
STATUS: deployed
REVISION: 1
NOTES:
kube-prometheus-stack has been installed. Check its status by running:
  kubectl --namespace monitoring get pods -l "release=prometheus"

Visit https://github.com/prometheus-operator/kube-prometheus for instructions on how to create & configure Alertmanager and Prometheus instances using the Operator.

deployment.apps/prometheus-kube-state-metrics         1/1     1            1           38s

NAME                                                             DESIRED   CURRENT   READY   AGE
replicaset.apps/prometheus-grafana-5b8b7f76c9                    1         1         1       38s
replicaset.apps/prometheus-kube-prometheus-operator-5b6f689465   1         1         1       38s
replicaset.apps/prometheus-kube-state-metrics-65865bc9bd         1         1         1       38s

NAME                                                                    READY   AGE
statefulset.apps/alertmanager-prometheus-kube-prometheus-alertmanager   1/1     31s
statefulset.apps/prometheus-prometheus-kube-prometheus-prometheus       1/1     31s

Creating a ServiceMonitor resource is a crucial step in setting up monitoring for your applications when using Prometheus. The ServiceMonitor resource provides a way to define and configure the endpoints that expose metrics within your Kubernetes environment. Here's the purpose and significance of creating a ServiceMonitor
vi servicemonitor-argocd-metrics.yml
apiVersion: monitoring.coreos.com/v1
kind: ServiceMonitor
metadata:
  name: argocd-metrics
  labels:
    release: prometheus-operator
spec:
  selector:
    matchLabels:
     app.kubernetes.io/name: argocd-metrics
  namespaceSelector:
    any: true
  endpoints:
  - port: metrics
Creating a ServiceMonitor for ArgoCD's Repo Server metrics serves the purpose of enabling Prometheus to effectively scrape and monitor the performance metrics exposed by the ArgoCD Repo Server. Let's break down the purpose of creating this particular ServiceMonitor resource:
vi servicemonitor-argocd-repo-server-metrics.yml
apiVersion: monitoring.coreos.com/v1
kind: ServiceMonitor
metadata:
  name: argocd-repo-server-metrics
  labels:
    release: prometheus-operator
spec:
  selector:
    matchLabels:
      app.kubernetes.io/name: argocd-repo-server
  namespaceSelector:
    any: true
  endpoints:
  - port: metrics
creating a ServiceMonitor for ArgoCD Server metrics is essential for seamless and automated integration with Prometheus, ensuring effective monitoring, and providing insights into the performance and health of the ArgoCD Server within a Kubernetes environment.
vi servicemonitor-argocd-server-metrics.yml
apiVersion: monitoring.coreos.com/v1
kind: ServiceMonitor
metadata:
  name: argocd-server-metrics
  labels:
    release: prometheus-operator
spec:
  selector:
    matchLabels:
      app.kubernetes.io/name: argocd-server-metrics
  namespaceSelector:
    any: true
  endpoints:
  - port: metrics
After you run kubectl apply to all three YAML files above, the scraping process will begin. Now you should be able to import the Argo CD dashboard.
kato@master1:~$ kubectl apply -f servicemonitor-argocd-metrics.yml
servicemonitor.monitoring.coreos.com/argocd-metrics created
kato@master1:~$ kubectl apply -f servicemonitor-argocd-repo-server-metrics.yml
servicemonitor.monitoring.coreos.com/argocd-repo-server-metrics created
kato@master1:~$ kubectl apply -f servicemonitor-argocd-server-metrics.yml
servicemonitor.monitoring.coreos.com/argocd-server-metrics created
Access Grafana Dashboard
Note, the default user/password is admin/prom-operator
kato@master1:~$ kubectl port-forward -n monitoring prometheus-grafana-5b8b7f76c9-wsztp 8080:80 --address 0.0.0.0
Forwarding from 0.0.0.0:8080 -> 80
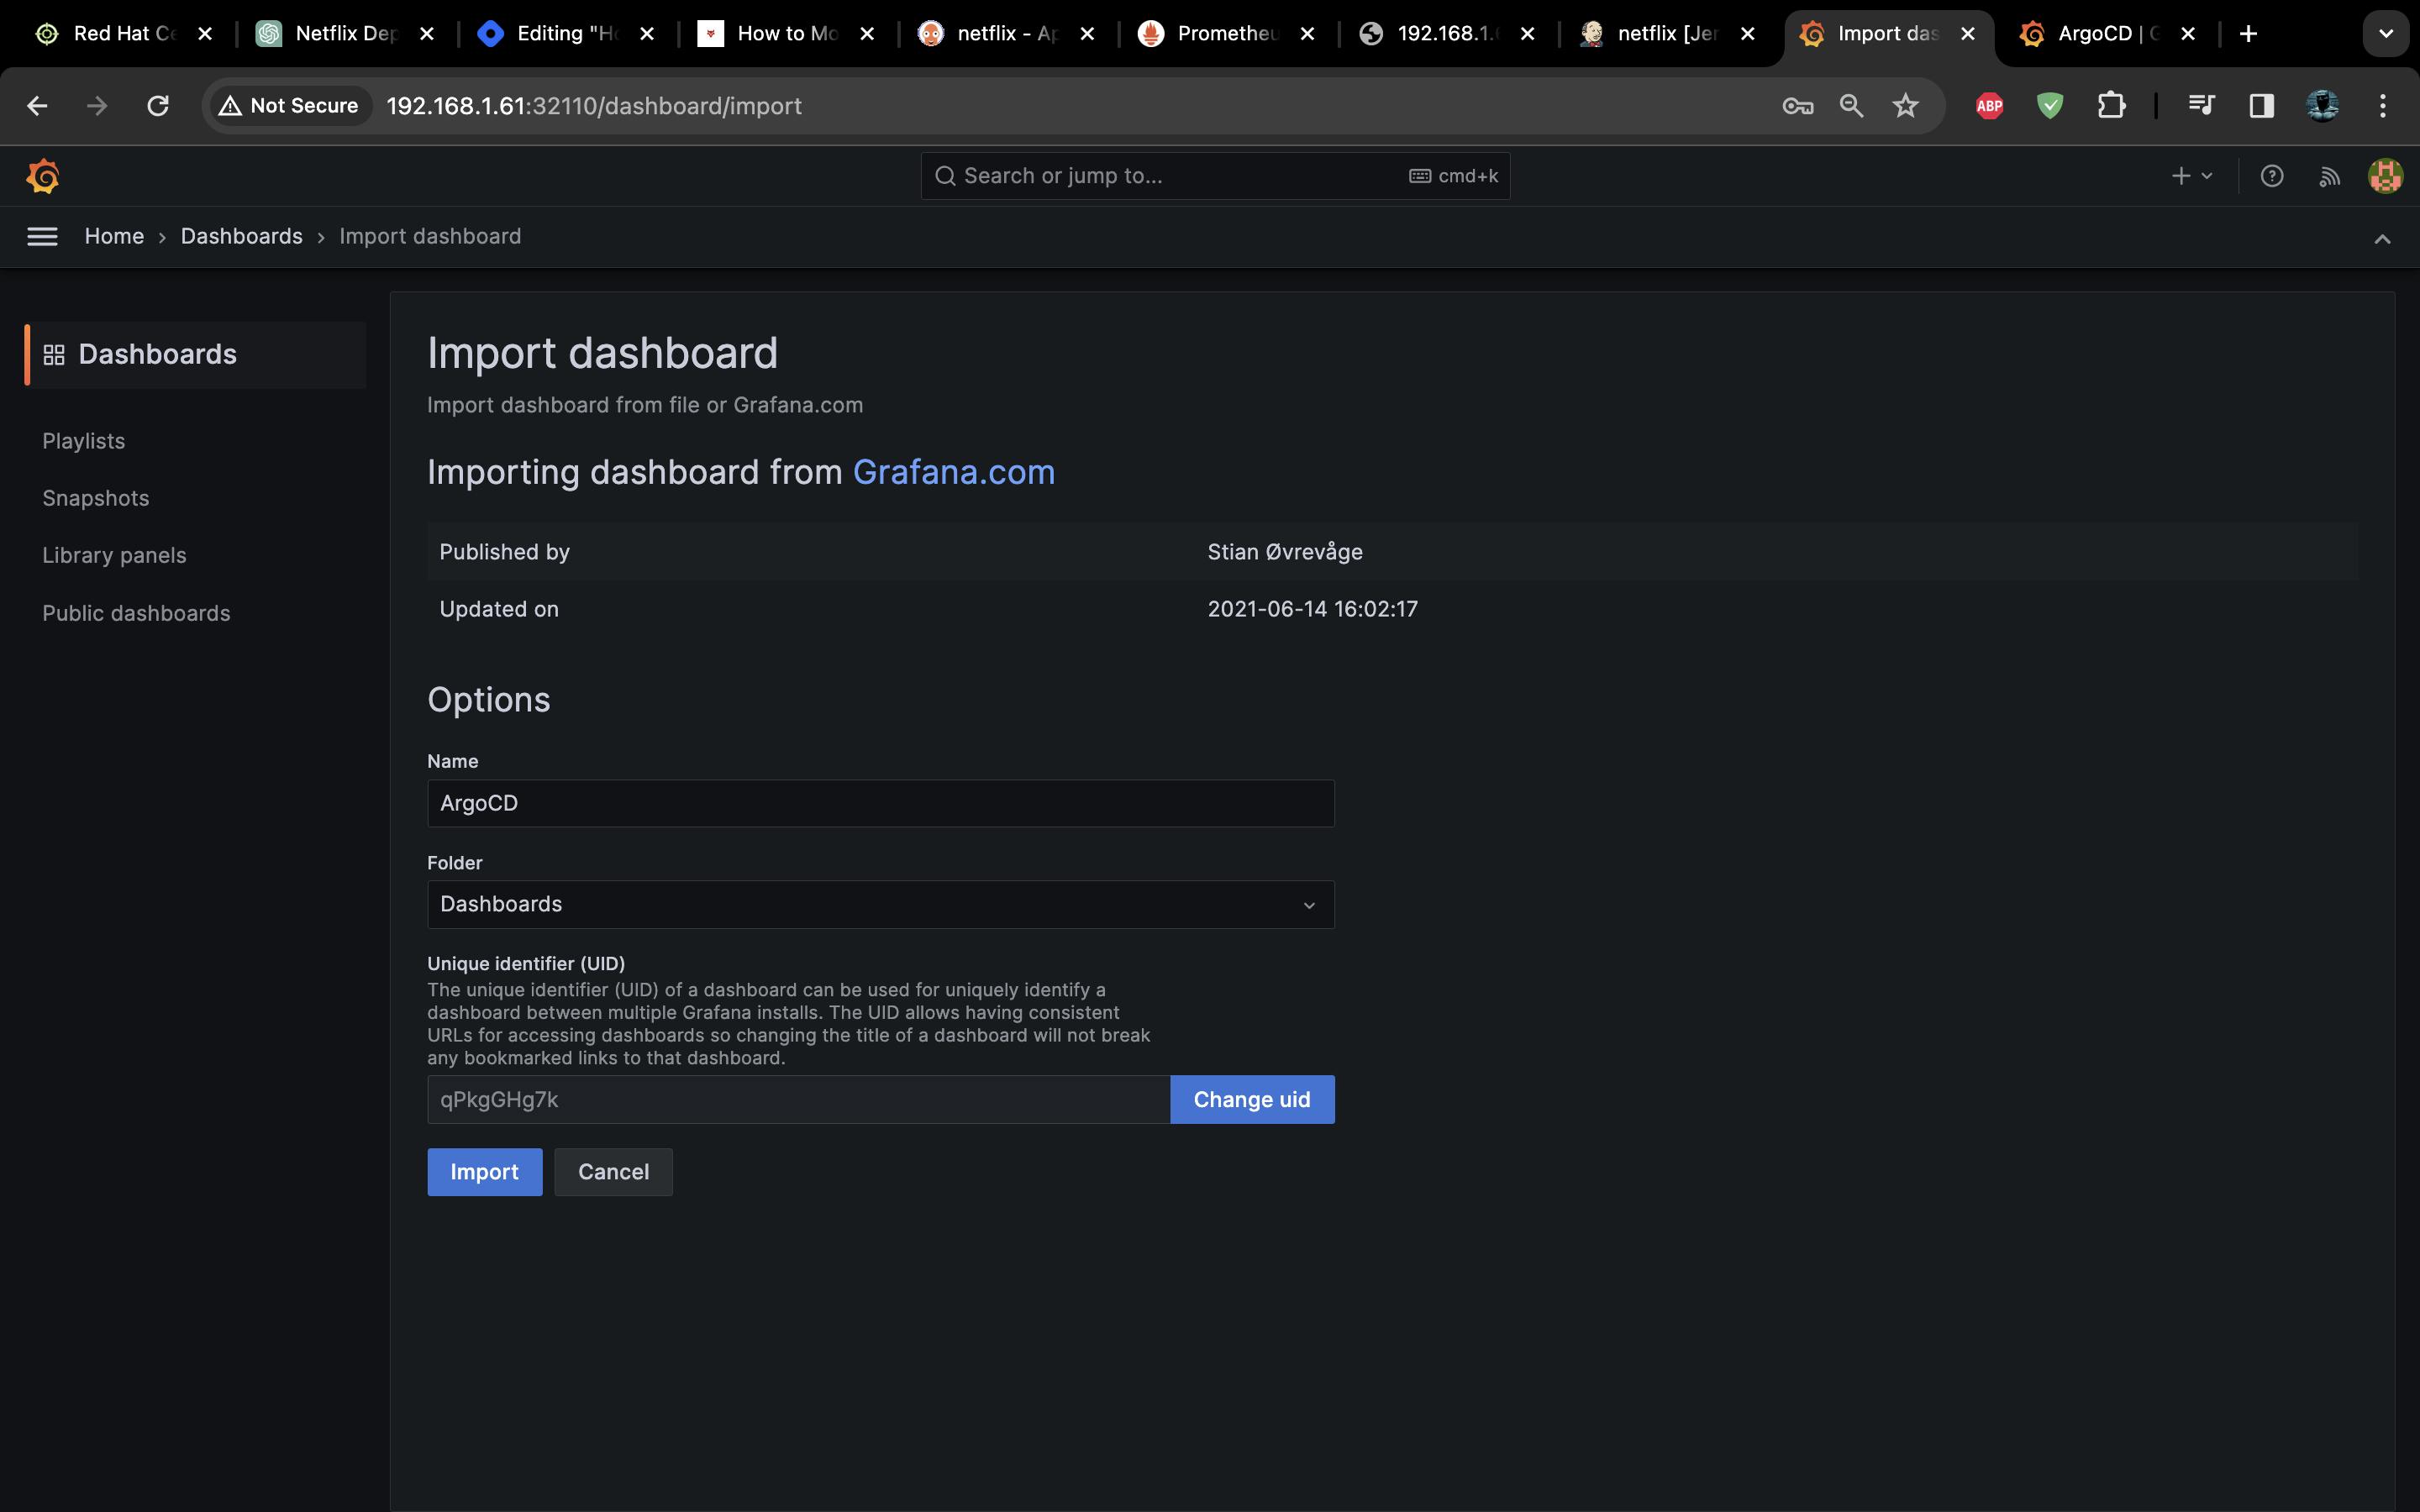
Now log into the Grafana dashboard, and start importing:

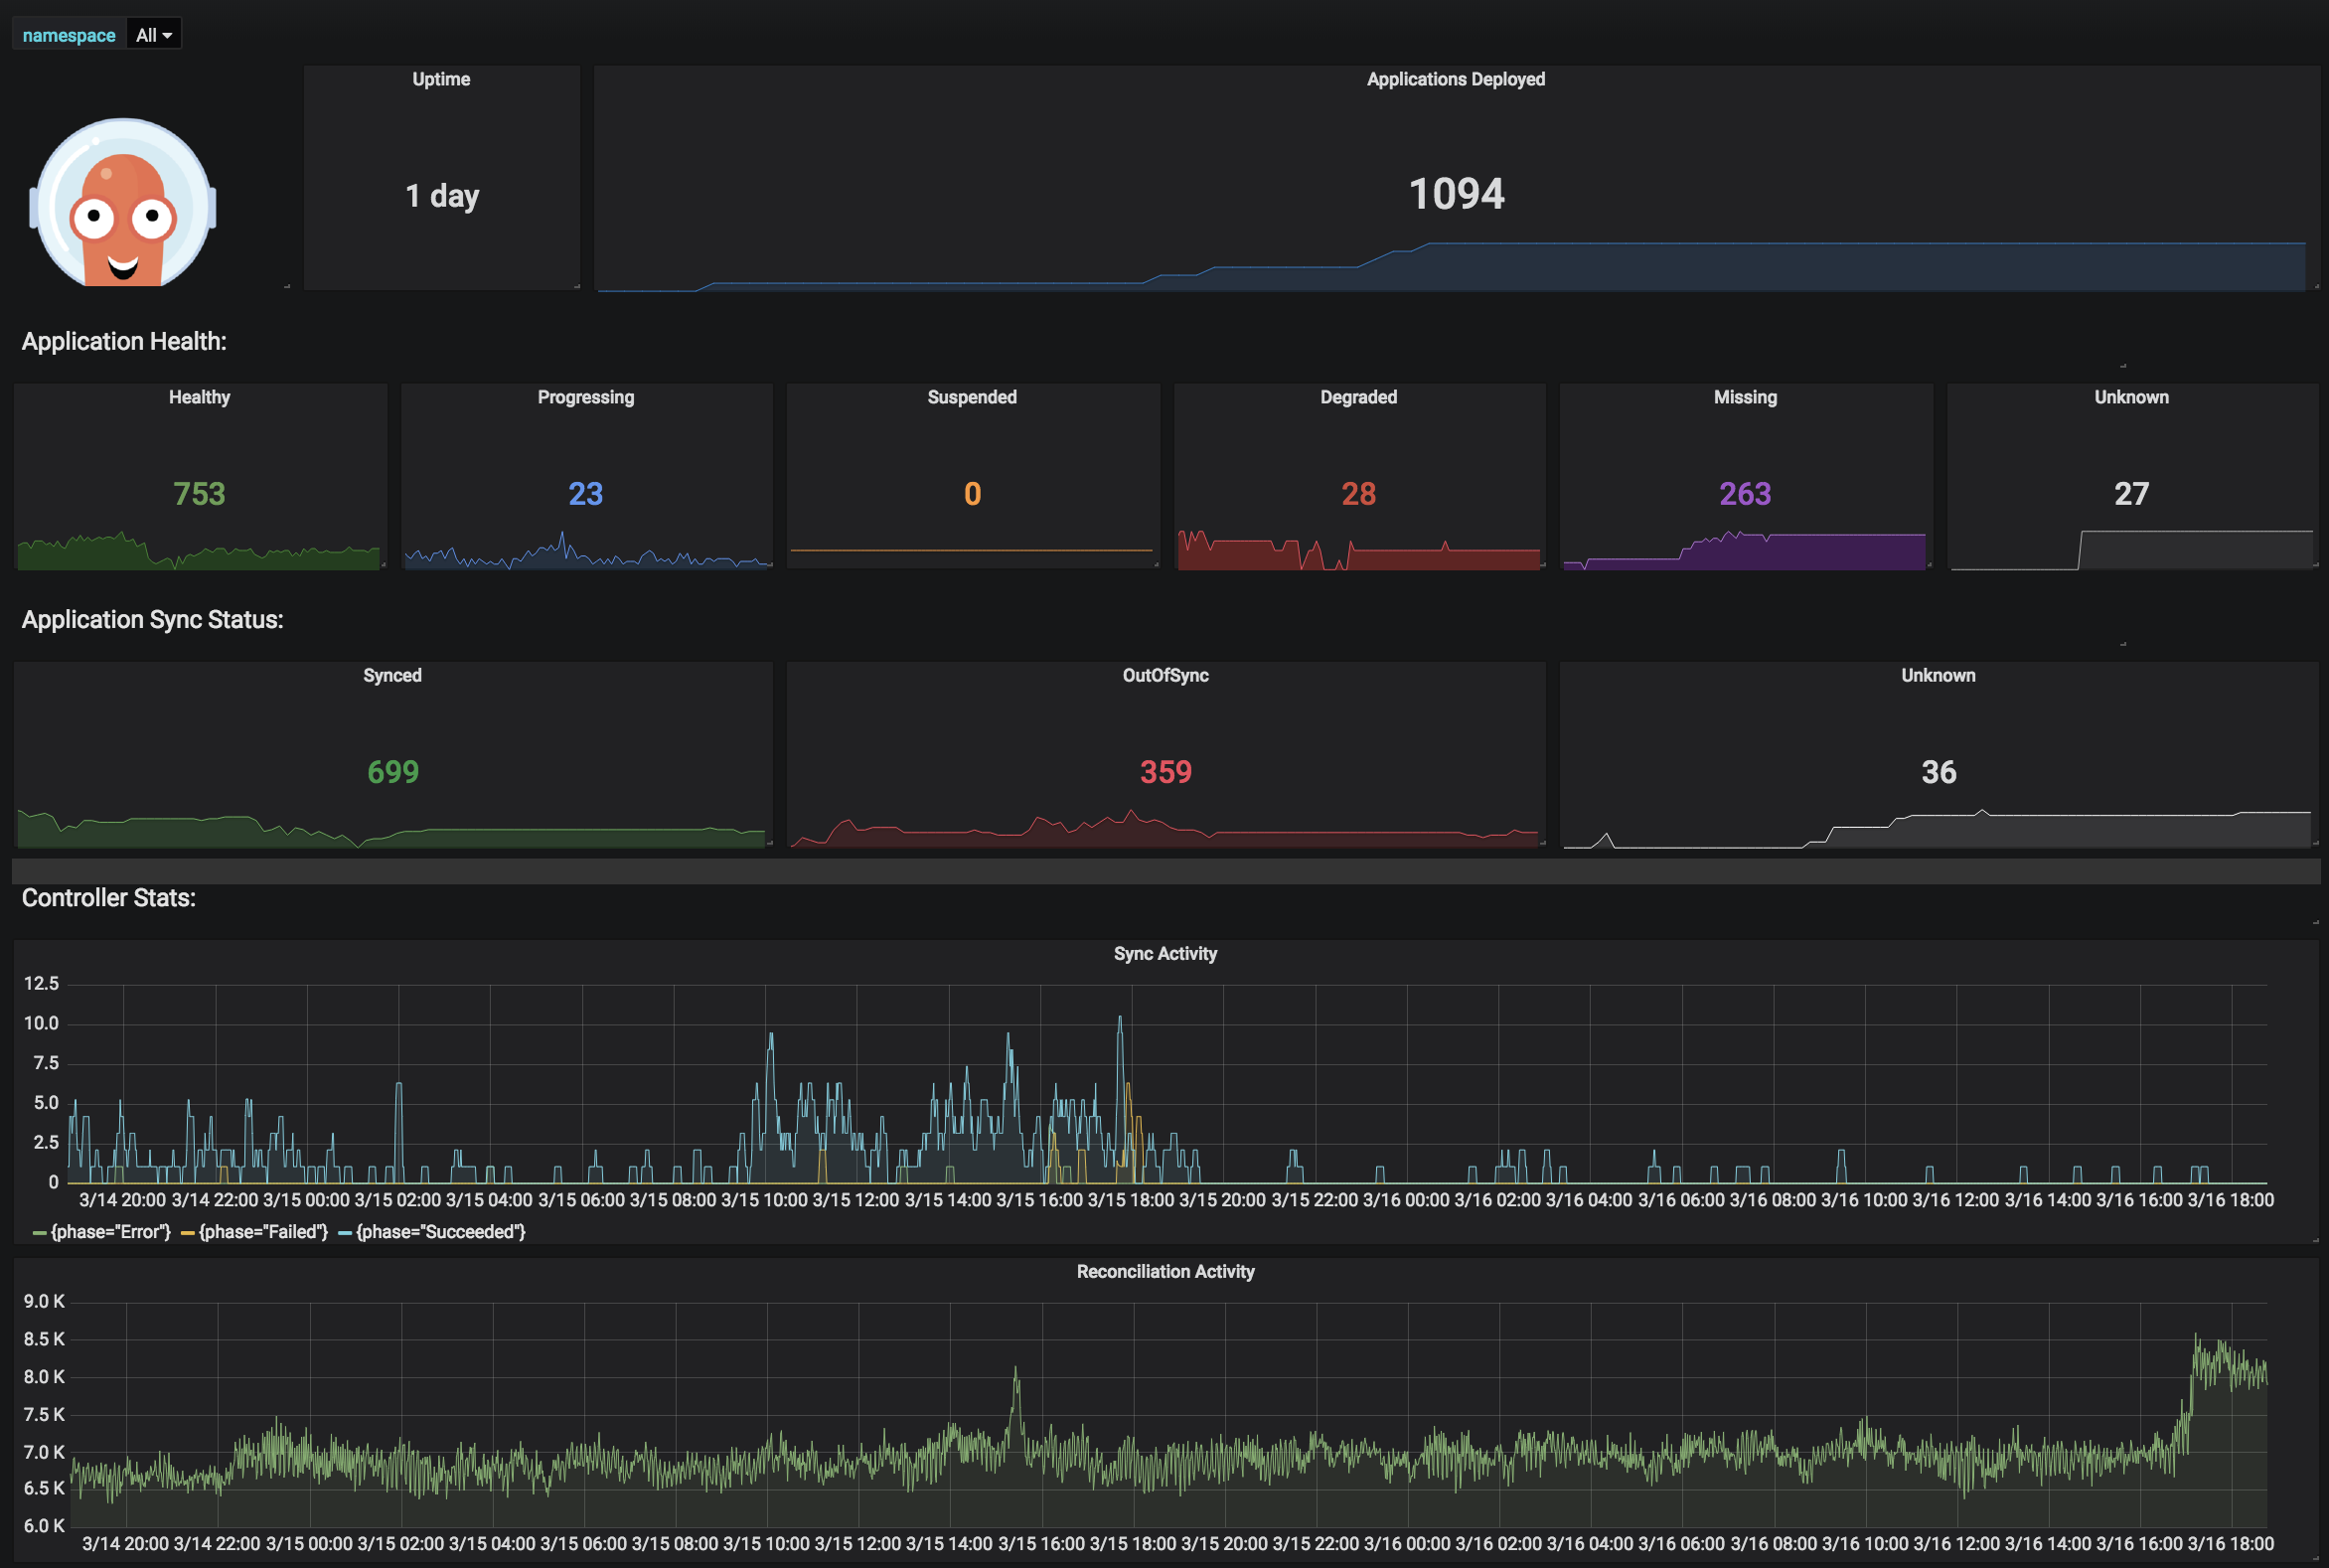
Once imported, you should be able to see the Argo CD dashboard:
Once you have activity on the ArgoCC namespace then Grafana will give you metrics on your resources
Cheers !